
User sessions are an important aspect of identifying the behavior of web users. In many cases there is a lot of effort on ensuring that a user spends as much time visiting a website as it increase the chance of consuming the services offered by that particular website, be that advertising material, sales, etc.
Onboarding Microsoft IIS logs in Azure Sentinel is just a matter of turning on IIS log collection for the Log Analytics Workspace where Sentinel is deployed. To do this, navigate to Sentinel, Settings, Workspace Settings, Advanced Settings, Data, IIS Logs and check the “Collect W3C format IIS log files” option.
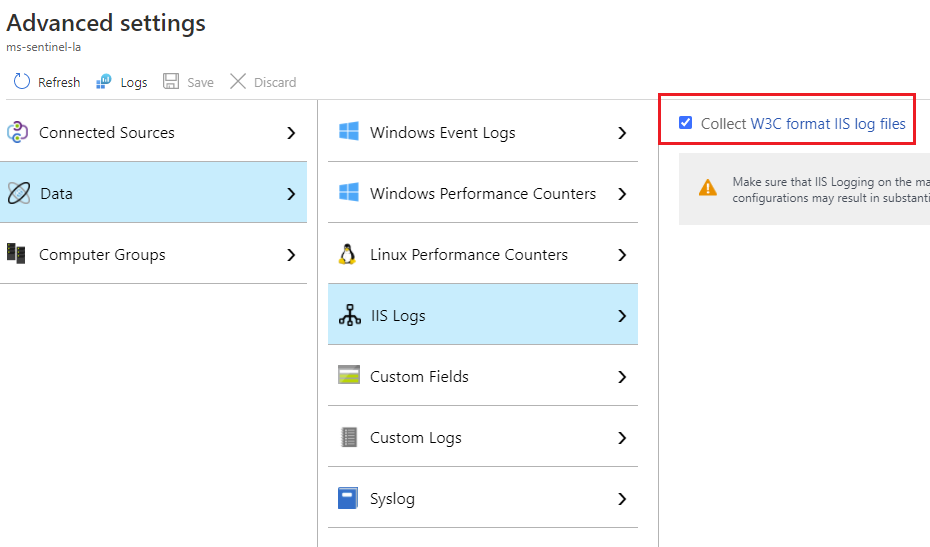
Once that is done, any Windows server that has the Microsoft Monitoring Agent installed, will have its IIS logs (if IIS is running) collected and sent to Sentinel, in the W3CIISLog table.
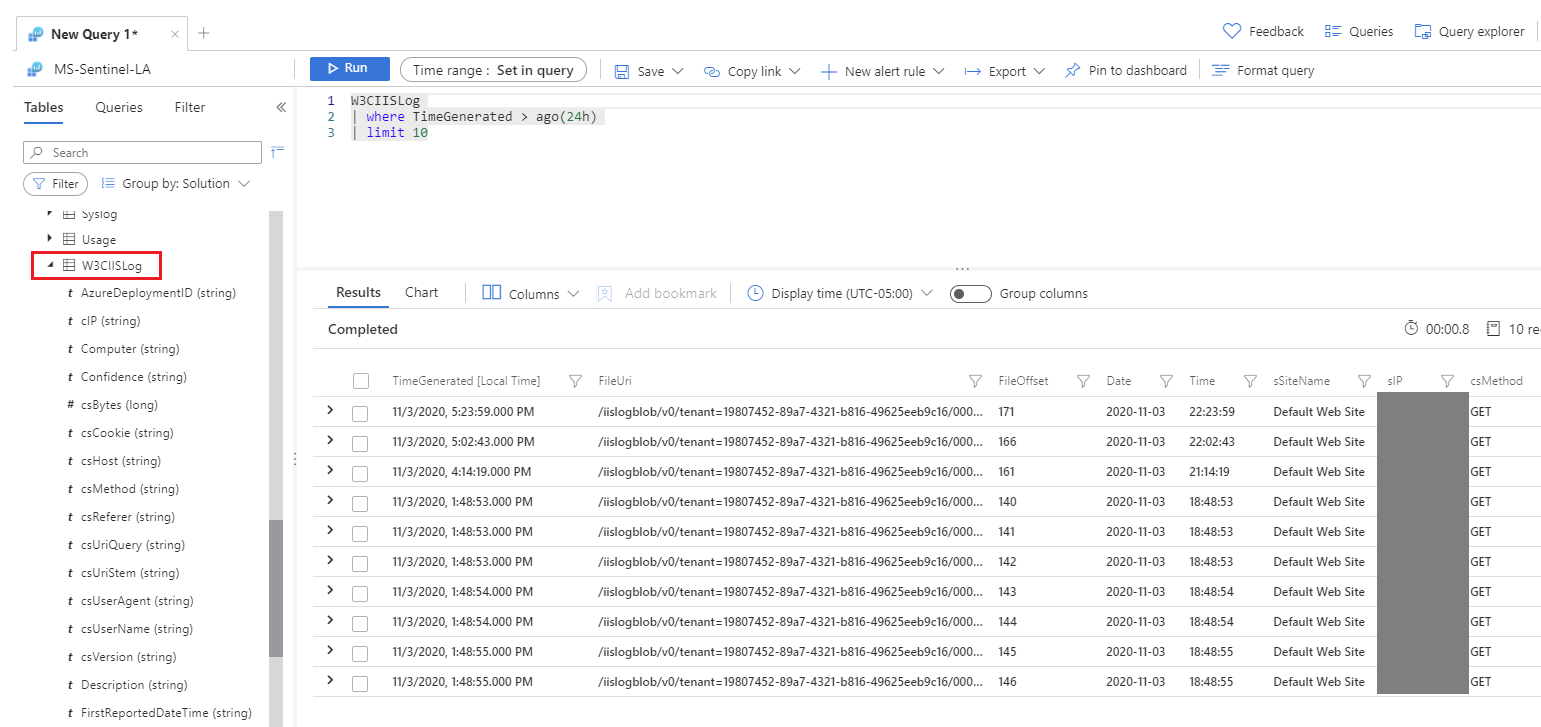
A typical record in the W3CIISLog contains details such as timestamp, IIS web site, client IP, requested URL, request method, request status, request duration, bytes sent, bytes received and additional details about that particular request. A record corresponds to one particular request but a browsing session can mean hundreds sometimes thousands of request. So how can the session duration can be calculated from the W3CIISLog table?
The Kusto Query Language function row_window_session() can be used in such situation to determine the beginning of a session for each client IP and with that information, one can use some additional KQL logic to determine the length of a session.
For this particular scenario, the row_window_session() function takes 4 parameters: the record timestamp, the maximum duration of a session, maximum “distance” between sessions and a criteria to identify individual sessions (the client IP in this case). This function required the data to be serialized, hence the need to sort it before using the function.
The script below, will return the total sessions duration by client IP address throughout 24 hours of IIS logs. If a client IP has multiple sessions, the result will indicate the sum of these sessions.
//sort by total session time
| sort by TotalSessionTimeSeconds desc
The comments in the script provide details on each step. The row_window_session() was used with the following parameters: 1 h as maximum session duration, 5 minutes between sessions and client IP to differentiate between initiators of sessions. The script can be adjusted to calculate sessions by specific site by adding the sSiteName field to the relevant project/summarize sections.
This script can also be used to identify potential abusers as their sessions will appear very long and evenly distributed throughout the day, in many cases with a duration around 70,000 seconds. Using a slightly modified version of the script above, one can list a set of the duration of each session:
W3CIISLog
//timeframe: last 24h
| where TimeGenerated >= ago(1d)
//filter to 2 columns only: client IP and timestamp of the record
| project cIP, TimeGenerated
//sort by client IP and then by timestamp (create a serialized table)
| sort by cIP asc, TimeGenerated asc
//calculate start time of each session (max session time: 1h, time between sessions: 5 min, reset/new session created when client IP different from previous)
| extend SessionStartTime = row_window_session(TimeGenerated, 1h, 5m, cIP != prev(cIP))
//summarize session end time (max TimeGenerated for the session) by client IP and session start time
| summarize SessionEndTime = max(TimeGenerated) by cIP, SessionStartTime
//filter to a table containing duration of the session (timespan/datetime format)
| project ClientIP = cIP
, SessionStartTime
, SessionEndTime
, DurationTime = SessionEndTime – SessionStartTime
//create an additional column with session time calculated in seconds (scalar format)
| extend DurationSeconds = ( DurationTime / 1s )
| sort by DurationSeconds desc, ClientIP asc
| summarize TotalSessionTimeSeconds = sum(DurationSeconds), Sessions=makeset(DurationSeconds) by ClientIP
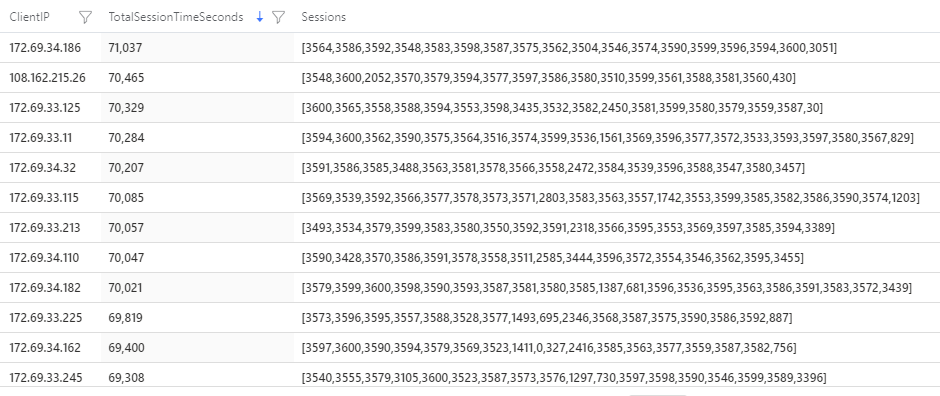
A filter can be used to count the number of such long sessions and trigger an alert and/or playbook that can notify the admin and even create a dynamic block list if the security control protecting the website supports it.
IIS log in general do not provide significant value from a detection perspective and have more use for understanding the user behavior, alert on operational issues and sometimes to perform post-incident analysis. However, as one can see in the example above, some of the data can be used to improve the overall security and identify potential threats.